SoloHI Unique Science
The visible emission at heights above 5 R⊙ is dominated by scattering from interplanetary dust, the F-corona. This is a nuisance for coronal studies as it obscures the signal from CMEs and coronal streamers. Accurate removal of the F-corona is essential for the derivation of coronal density structure (e.g. Hayes et al. 2001), but the current F-coronal models are insufficient, as LASCO-C3 and SECCHI/HI-1 observations have shown. Stenborg & Howard (2017a) and Stenborg et al. (2018a) found that the shape and intensity of the F-corona vary significantly as functions of ecliptic longitude and heliocentric distance and that the dust cloud is not a simple axisymmetric structure.
A different approach is required for the continuously varying scene in the SoloHI images. A new technique to determine the background has been demonstrated successfully on the SECCHI/HI images (Stenborg & Howard 2017b); it uses a single image to generate a background model, under the assumption that the F-corona varies monotonically and smoothly.
The combination of the SoloHI remote-sensing F-corona observations with dust models may allow the estimation of the size distribution of the dust in the inner heliosphere. In particular, the analysis of the changes in the distribution of particles below a few micrometers will yield information about the effects of solar radiation and the plasma environment on interplanetary dust (Mann et al. 2000; Jones et al. 2018).
The SoloHI F-corona observations during the maximum of cycle 25 from high latitudes and within 0.5 AU provide an unprecedented and probably unique possibility to investigate whether CMEs interact in any significant way with the interplanetary dust and whether we can use this interaction to probe the CME magnetic fields. This was suggested by Ragot & Kahler (2003), who predicted that the strong transient magnetic field in a CME can produce a temporary displacement of a small region of dust particles.
1. Signal-to-noise Ratio
The total diffuse sky brightness observed by SoloHI is the sum of contributions from the F-corona (scattering from dust) and K-corona (scattering from electrons in the solar wind and CMEs), as well as integrated starlight from unresolved stars. The dominant contribution throughout the SoloHI FOV comes from the F-corona. In addition, numerous bright stars will be resolved as individual point sources of light. These stars will be removed from the images using techniques that have been developed and successfully implemented on SECCHI/HI.
The fundamental observational requirement is to obtain images with sufficient photometric precision to discriminate the K-corona, and its fluctuations (e.g. CMEs), from the other contributions to the total signal. Figure 1 shows a comparison of the 1σ photon noise detection limit for the SoloHI with the expected signals. The detection limit shown here is for a single pixel and an exposure of 30 min at aphelion and 30 s at perihelion. The expected contribution of the F-corona was determined from the model of Koutchmy et al. (1985). The integrated starlight varies considerably with galactic latitude and longitude; an average contribution over the SoloHI FOV is shown in Figure 1. The expected contribution from CMEs is from Helios measurements by Jackson et al. (1985) and from SECCHI/HI measurements. The 1σ detection limit remains below the expected CME signal over the full FOV. A signal-to-noise ratio (S/N) of 5 for a two-pixel resolution element is required for threshold detection of a simple, known a priori target on a flat background (Rose 1948; Barrett 1990), and substantially higher photon statistics (S/N > 30) are required for more complex or unknown targets.
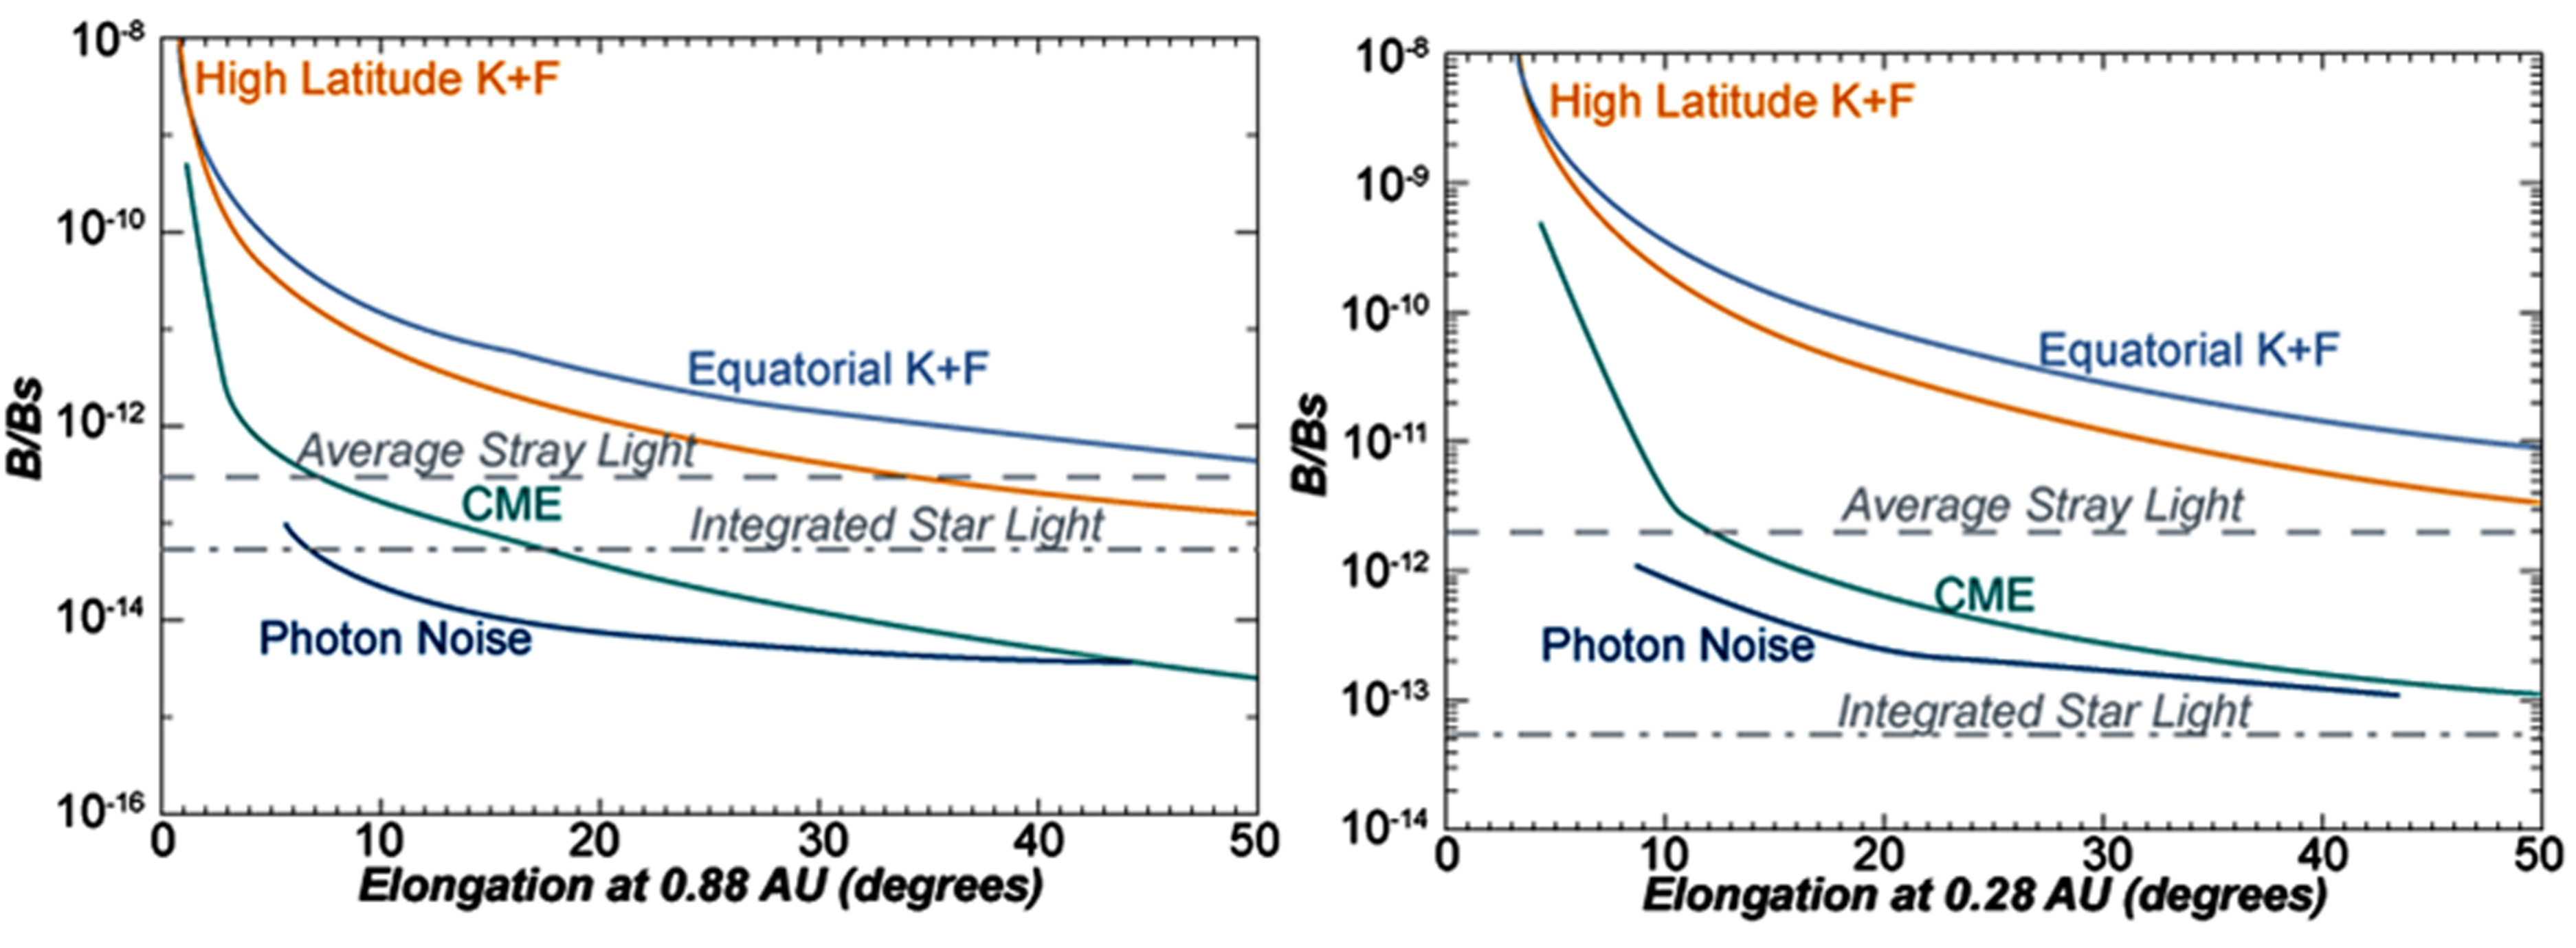
Figure 1: Expected contributions to the SoloHI signal as a function of elongation angle when the spacecraft is at perihelion (0.28 AU) and aphelion (0.88 AU). The 1σ photon noise detection limit per pixel is shown for an exposure of 30 min at aphelion and 30 s at perihelion.
These criteria are easily met over most of the SoloHI FOV. Near the outer part of the field, binning of pixels and/or longer integration times will be used to enhance the desired signal. At perihelion and/or in the inner part of the field, a substantially higher cadence using subframes can be achieved without any degradation in spatial resolution.
2. Thomson Surface Considerations
Solar wind features at progressively large angular distances from the Thomson surface scatter less than features close to the surface. Therefore, the SoloHI measurement sensitivity and its scene coverage are defined by the Thomson surface that varies with the Sun–observer distance (Vourlidas & Howard 2006).
Figure 2 shows an estimate of the SoloHI scene coverage for three Solar Orbiter positions along the orbit for the minimum perihelion, indicated by a number and a color. There are three curves for each SoloHI location that are plotted with the same color and define the distance along the SoloHI line-of-sight, where the integrated scene brightness reaches 5, 50, and 95% of its total brightness integral. Ninety percent of the scene brightness captured by the SoloHI instrument lies between the two outermost solid-line curves. The numbers in Figure 2 refer to separate locations along the orbit. The number “2” is at the orbit perihelion of 0.28 AU, while “1” and “3” are both at 0.34 AU, on the inbound and outbound parts of the orbit, respectively. The arcs are indicating the location in the FOV, with the outer point of the arc being the largest elongation in the FOV and the inner point being the smallest elongation. The orbital transit time from position “1” to position “3” is approximately 17.6 days. As the Solar Orbiter orbital position approaches its perihelion (position “2”), the SoloHI instrument primarily measures Thomson-scattered light from within 40 R⊙ of the Sun center and therefore becomes a local imager. This behavior of the scattering is very different from that at 1 AU.
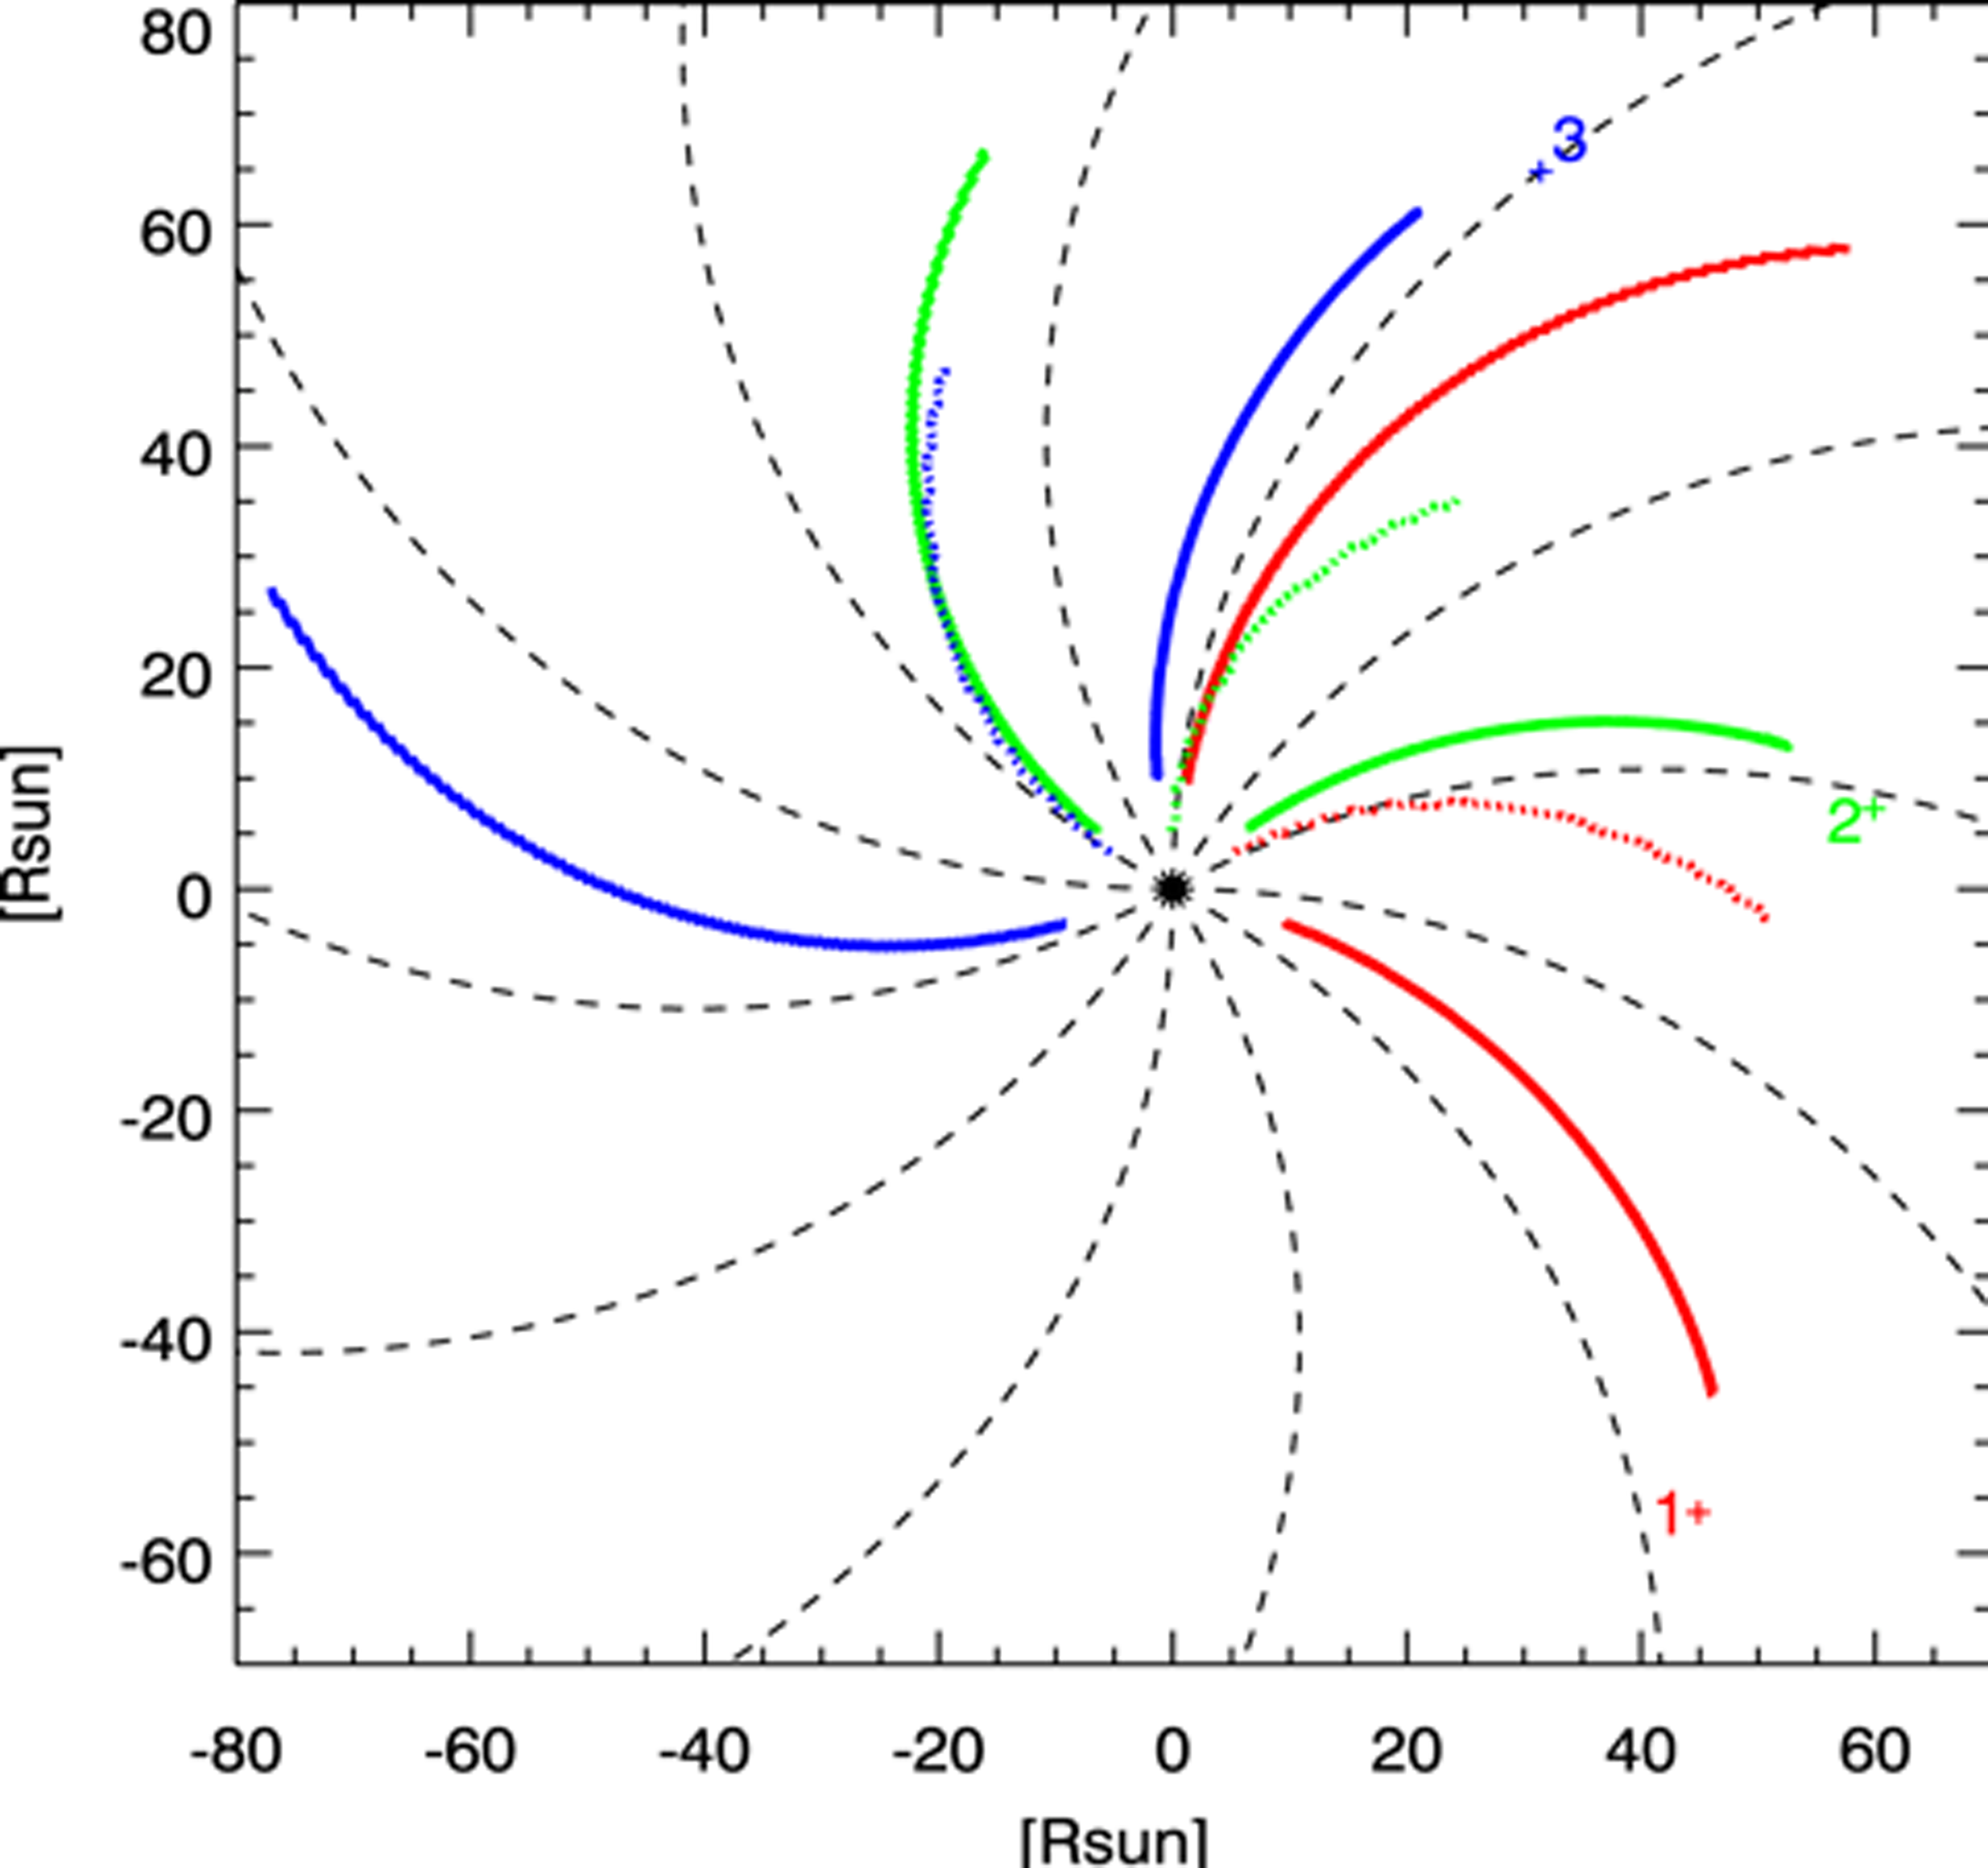
Figure 2: Sensitivity map of the Thomson scattering emission for the Solar Orbiter–Sun geometries at perihelion. Each number signifies the location in orbit identified by the + (“2” is a perihelion of 0.28 AU, while “1” and “3” are both at 0.34 AU). The three differently colored arcs mark the loci of three percentages of the total brightness integration along the LOS. The solid line closest to the location gives the loci at 5% of the total integral, the dotted line gives 50% and the solid line farthest from the location gives 95%. The extents of the arcs mark the SoloHI FOV. The black dotted lines show the direction of the Parker Spiral for a 300 km s−1 wind.
The PSP orbits have perihelia from 35 R⊙ to 9.8 R⊙. Because both PSP and Solar Orbiter are encounter missions, there is a small but finite probability that PSP will be in the FOV of SoloHI. When it is, Figure 2 demonstrates that SoloHI will easily detect the features passing over PSP while being sensitive to the solar wind flowing towards Solar Orbiter. This will provide an absolutely unique opportunity for joint observations.